

In this video, we are going to learn how to use the new attachment support of pro@coder and turn a static image into an interactive chart (using Anthropic Opus 4.5, which is awesome).
Video also available on YouTube (better experience on Mobile)
See below for the asset and prompts.
Image reference: https://www.vecteezy.com/vector-art/4063019-nice-graph-design
(from Gerardo Giuseppe Ramos Granada)
Key Points for #ProductionCoding with AI
✅ Workflows matter more than tools and models.
✅ File-based for scale (e.g., do not code in a chat box)
✅ Use tools that allow you to OWN your context.
The last point is the most important,
👉 For maximum AI coding quality, use CONTEXT LENSING.
Context lensing is about having tight control of what we want the AI to see and not see.
Step 1 - Initial
In the pro@coder prompt, paste the image and use this prompt.
In the web-content/ folder, implement index.html to display the chart shown in the image.
- Use canvas2d
- Follow the same dot positions as the image
- Chart should take up 2/3 of the page
- Resize with the page and be centered.

Step 2 - Add toolbar and toggle
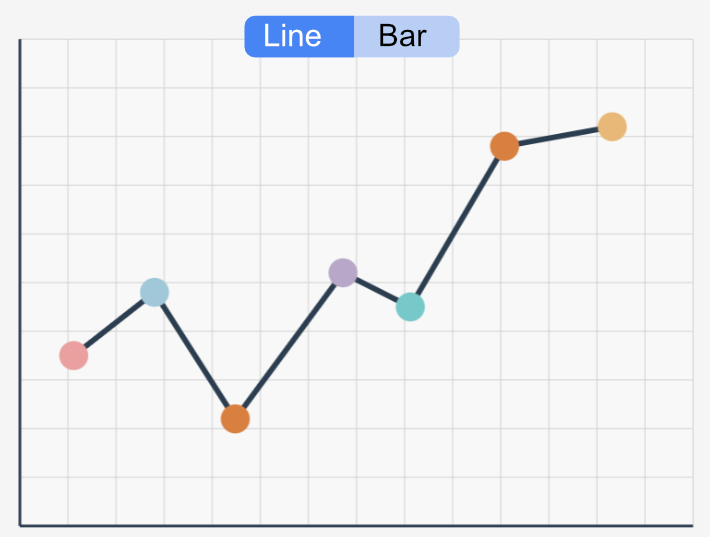
Implement the toggle toolbar as shown in the image, and implement the bar view.

Step 3 - Fix the UI
Position the toolbar so that it overlaps with the top line of the chart and make it larger, as shown in the `chart-with-toggle-reference` image.
Look at the `actual-chart-implemented` image to see how it currently looks.


Step 4 - Number cheating
Now, when in line mode, allow the user to drag the dot vertically and keep the lines connected to it.#AIProductionCoding#VibeCoding to #AIProductionCoding
